
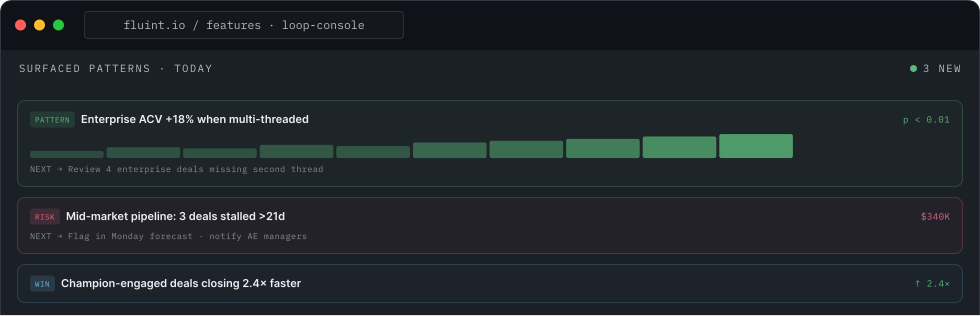
The GTM data that matters, surfaced and visualized for you.
Dashboards assume you already know what to look at and how to chart it. Loop surfaces what matters and builds the view for you.
The insight is only as good as the question you thought to ask.
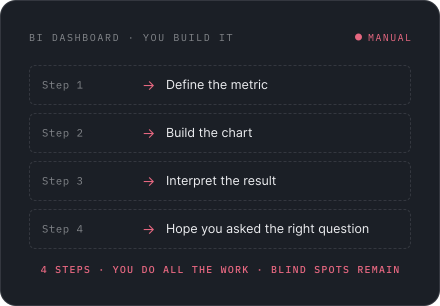
Revenue intelligence makes you define the metric, build the view, and interpret it. But the pattern quietly costing you deals is hiding in the chart you never thought to build.
- BI dashboard · you build it Manual
- Step 1: Define the metric
- Step 2: Build the chart
- Step 3: Interpret the result
- Step 4: Hope you asked the right question
4 steps · you do all the work · blind spots remain
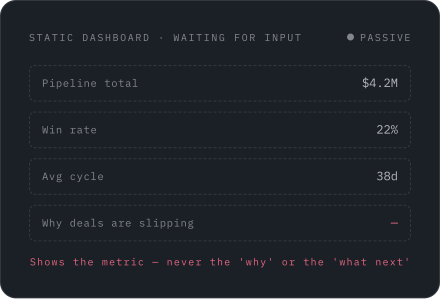
Dashboards show what you asked for. They never show what you missed.
BI waits for your question. It doesn't scan your data for patterns you haven't noticed, compose the visual, or tell you what to do next.
Loop Console in three steps
Loop discovers what actually matters in your deals.
It builds the right visual for you.
Ask anything to go deeper.
Teams on Loop Console see compounding results.
Fluint vs. Revenue Intelligence Dashboards. Why dashboards make you do the work.
Questions about Loop Console.
Loop continuously scans your revenue data for statistically significant patterns — things like segment-level win rate shifts, predictor changes, or pipeline risk clusters. It surfaces what's material, not what's noisy.
nstead of showing a raw number, Loop builds a chart, a written narrative explaining what it found, a confidence level, and a recommended next step. You read the insight, not build the dashboard.
Yes. After a pattern is surfaced, you can ask in plain language — "break this down by segment" or "show me the deals behind this" — and Loop builds the answer on the fly, sourced from your data.
Monitors are alerts you set on any pattern or metric. When a line bends — pipeline drops, a predictor shifts, a segment stalls — Loop pings you automatically so you catch it early.
See what matters to your revenue.
Start free, connect your stack, and Loop surfaces your first patterns the same session.